|
On this page, we
explain how to explore MapEcos,
search for a facility of interest,
and interpret what you see.
Exploring MapEcos
How to
move around the map.
-
Click
on the map, hold the mouse down, and drag
the map. Release the mouse to stop dragging.
-
Double
click on the map to center the map there.
-
Click
 to
jump to a location by typing a location name, street
address, city, state, or zipcode. to
jump to a location by typing a location name, street
address, city, state, or zipcode.
-
Clicking
 will
take you back to your last
location, or the United States. will
take you back to your last
location, or the United States.
How to
zoom in or out.
-
"Zoom" by clicking
 and
then clicking two corners of a bounding box. and
then clicking two corners of a bounding box.
Remember: click one corner, release the
mouse button, click another corner.
-
Use
the scale tool

Getting
Facility information.
Browse:
Go anywhere on the map where you see red and blue dots.
Zoom in about half way. Roll
the mouse over a marker to get the name of that facility. Click
on it to get information on that facility.
Search: Enter search terms in the "tools" find and mark all of
the facilities that match a given criteria. Matching
facilities will appear in a list in the left column. All of
the facilities in the list will be shown as dots on the
map. Facilities at the top of the list are also identified
by markers (i.e. little pins). To see other markers, click
through the list using the arrows at the top of the search.
Or, if you have selected to sort by distance, move the map
to a region of interest.
Search Tips.
| |
|
|
| |
 |
|
<- Changes
the order of the search results. |
|
<- Enter a
facility name. |
|
<- Enter an
industry name or and SIC code (Petroleum or
2911). |
|
<- Enter a
name to see all of the TRI facilities in
that company. |
|
<- Enter a
chemical name where it is emitted. |
|
<- Enter
level to see facilities with higher or lower
emissions (e.g. 3, or 9, etc. Don't enter
"level"). |
|
<- Enter
level to see facilities with higher or lower
hazard scores. |
| <- Search
will report results that match
all
criteria. |
|
Remember, the
 button at MapEcos will always bring back summary
instructions on how to get around the map.
button at MapEcos will always bring back summary
instructions on how to get around the map.
Interpreting data on the facilities.
Facility Summary: Point color and emissions levels
Most facilities in
the US have low emissions, while a few facilities have enormous
emissions. In calculating our levels and in setting
the color of the facility marker dot, we wanted to take this
into account. As a result, we created an exponential scale
for our dot color and in calculating the "Emissions Level" and
the "Hazard Level". The cutoff for each level is 10X that
of the previous one. A facility with the median
level of emissions (Level 3) will have a dot color that appears
between blue and purple. For more information on how we
calculated our levels, click here.
The following two
graphs show just how skewed are emissions.
Even with our exponential
scaling, the vast majority of emissions come from levels 7,8,
and 9. Yet, the number of facilities in these levels
represent only 2.5% of the total. The one facility as
level 9 has far more emissions that the bottom 6 levels (totally
90% of all facilities).
But again, we encourage you to be
careful in drawing conclusions. Many of the facilities
with high emissions or hazard scores are
very large and they operate in industries where emissions are
hard to avoid. They may be bringing you your electric
power or the aluminum for your soft drink can.
For more data on emissions among
the different levels, click here.
Operations Data
We asked managers
from each facility to answer a survey about how they try to
control their toxic emissions and then use the map to tell their
story. If you click on the “operations” tab, you will find what they reported. When you are just browsing an area, you can
tell those facilities that have reported information by the existence of a
green ring.
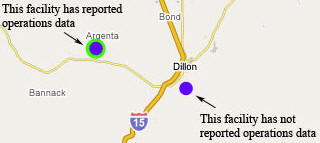
When you see such a ring, some
data will be reported in the operations tab for that facility.
Check out what they are doing and compare it to others. It may
also be informative just to see who is reporting!
Emissions Details and Comparison
Data
You may also want to check out
the emissions data and the comparison graphs. These tabs reveal
information about the main chemicals the facility releases to
the air. We chose to use air emissions because those are the
bulk of the US Emissions. We plan to include other types of
emissions in the next revision.
The comparison tab
allows you to see how the facility compares to others in its
region and industry.
 |
This trend graph allows comparison of changes in
emissions over time. In this industry, both the
focal facility
 and the
industry on average and the
industry on average are improving.
 |
 |
To form this
graph, we calculate the highest emitted for that
industry and then divide this number by six. We
identify all of the firms in each of the 6 levels.
This histogram shows how many are in each level.
This facility is in the highest level which is labels
>83%. That is, it is in a group of facilities
which number a bit less than 124 who emit between 83 and
100% of the emissions released by the larges emitter in
the industry. |
|